Notices of the recent Municipal Property Assessment Corporation’s (MPAC) internal statement about the prescribed use of propertyline™ data relating to square footage is circulating among real estate professionals and we wanted to tell you how that may play out for your clients.
Understanding the MPAC announcement
Essentially MPAC is reiterating their directive that propertyline™ data and reports are only to be shared by agents directly to their clients for internal purposes and not to be posted online. Specifically, MPAC square footage is still prohibited from being posted on any public or private real estate listing portals or websites, including agents’ websites and REALTOR.ca.
It’s important to note that this is not a new directive. MPAC has always restricted the use of propertyline™ data, however many Ontario boards turned a blind eye to the infraction because home buyers and sellers demanded that listings provided square footage. But their reliance on MPAC data wasn’t doing their clients any favours.
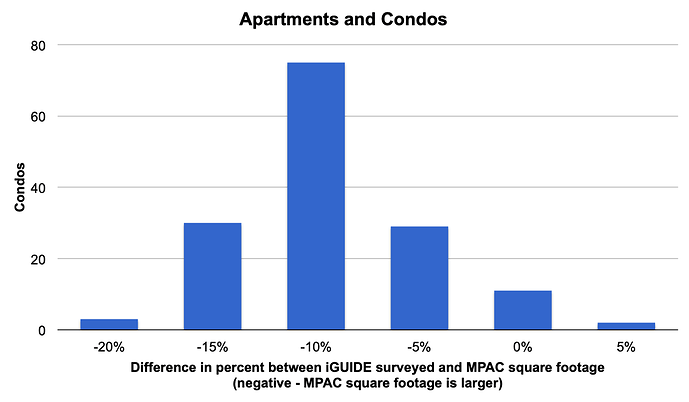
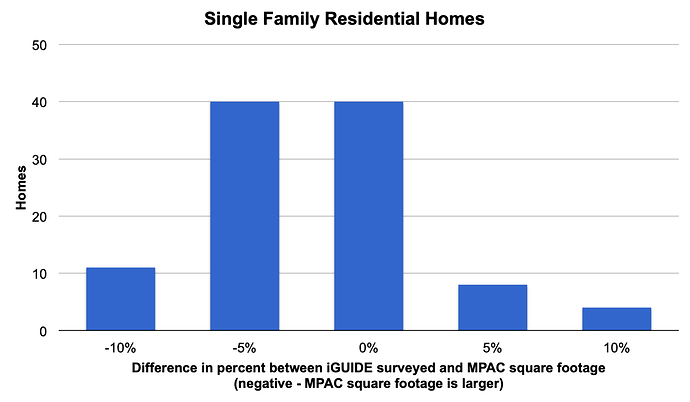
According to Alex Likholyot, “the study we conducted in Ontario, Canada, revealed that the differences between reported MPAC square footage and the square footage obtained via iGUIDE floor plans can reach up to 20%. In general, tax records’ square footage is often outdated and not very accurate.” (See below graphs)
**See bottom for study information
Understanding that square footage information is deemed essential by both agents and the home selling/buying public, MPAC has identified a concession. Rather than a total ban on publicly using the square footage data, they have announced that stating a square footage range is acceptable; however members of ORTIS require an exact figure to be entered to create a new listing.
What this means to your clients
This is great news for your clients. Their competition’s listings will not show essential square footage information, whereas iGUIDE square footage values will continue to flow through to the public.
The defined square footage ranges leave a lot of room for interpretation and misunderstanding, especially when we look at the defined ranges of a typical apartment size, 700-1100 sq ft which has a 44% spread, or a mid-range home at 2000-2250 sq ft which is a 12% spread. The potential difference in size doesn’t provide the necessary information for home buyers trying to understand the true size and value of a listing. A lot of property decisions come down to comparisons of dollars/sq ft.
Realtors recognize the importance of square footage information to home shoppers and will want to keep providing it, but will not want to violate MPAC policy. Let your market know that they can continue delivering this important information by using iGUIDE.
This is a market differentiator that will lead to winning more business as iGUIDE clients will distinguish themselves and their listings by offering the public this vital, sought after information.
Study Information
*The study was conducted in 2017 and included 100 randomly selected homes and 150 randomly selected condos for which both iGUIDE floor plans and MPAC data were available. The majority of the differences in the condos’ square footage result from builders occasionally including in reported unit size parts of demising walls, balconies, and void spaces, such as utility shafts that service the whole building. The majority of the differences in the homes’ square footage result from including spaces such areas open to below or lower levels completely or partially below grade; complex floor plans with the footprint of the second floor differing from the first floor that cannot be properly surveyed from outside by MPAC assessors; outdated MPAC information on building additions constructed by homeowners.

